Idaho Hunt Planner We got game.
Hunt Area
All of Units 60, 60A, 62, 63, 63A, 64, 65, 66, 67 and 69.
More information about the Game Management Unit(s) in this area: 60 60A 62 63 63A 64 65 66 67 69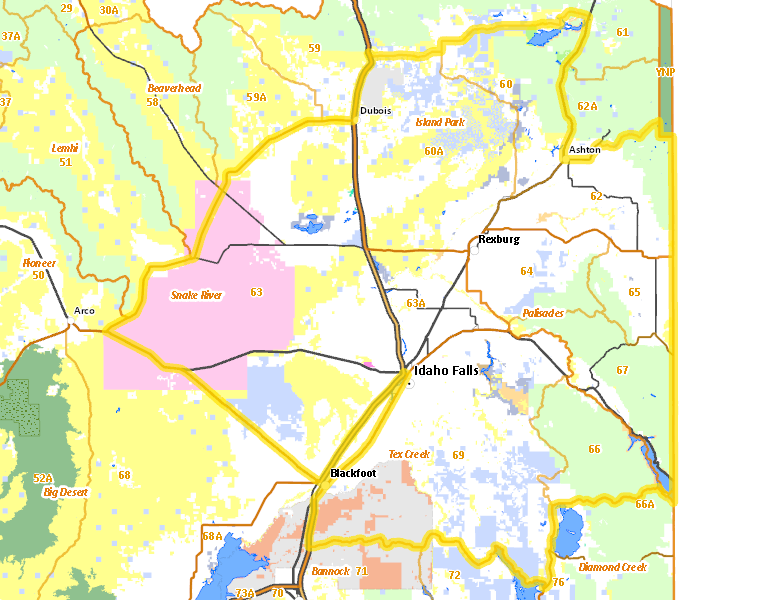
Surface Management
For government land, these data show the managing agency of the land, which may or not be the same as the owning agency.
 Private 46.33%
|
|
U.S. Forest Service (USFS) 14.72%
|
|
U.S. Bureau of Land Management (BLM) 13.35%
|
|
U.S. Department of Energy (DOE) 10.26%
|
|
State of Idaho 8.2%
|
|
Indian Reservation / Bureau of Indian Affairs 3.07%
|
|
State of Idaho 1.01%
|
|
Indian Reservation / Bureau of Indian Affairs 0.9%
|
|
U.S. Bureau of Reclamation (BOR) 0.89%
|
|
Other 0.57%
|
|
Other 0.28%
|
|
State of Idaho 0.22%
|
|
U.S. Corps of Engineers (COE) 0.14%
|
|
U.S. National Wildlife Refuge (NWR) 0.05%
|
|
U.S. Military 0.02%
|
|
U.S. National Park Service (NPS) 0%
|
Make your own map of Hunt Area
Ownership data source: Inside Idaho
Access Yes! Properties
Access Yes! is Fish and Game program designed to improve hunting and fishing access to private land or through private land to public land by compensating willing landowners who provide access.
No properties are currently available in .
View all Access Yes Participants.
Forest Service Land
Check for road and area closures on National Forest websites
Federally-designated Wilderness Areas
No motorized vehicles are allowed in these areas.
There are no wilderness areas in .
Land Use/Land Cover
|
Rangeland
41.68
%
|
|
Forest
17.11
%
|
|
Irrigated-Sprinkler
14.3
%
|
|
Dryland Agriculture
11.96
%
|
|
Irrigated-Gravity Flow
9.75
%
|
|
Rock
2.2
%
|
|
Riparian
2.1
%
|
|
Water
0.55
%
|
|
Urban
0.32
%
|
Make your own map of Hunt Area
Land Use data source: IDWR
Towns in this Hunt Area
- Idaho Falls, Interstate 15 US 20 US 26
- Rexburg, US 20 Idaho 33
- Blackfoot, Interstate 15 US 26 US 91
- Shelley, US 91
- St. Anthony, US 20
- Rigby, US 20 Idaho 48
- Driggs / Tetonia / Victor, Idaho 33
- Ashton, US 20 Idaho 32 Idaho 47
- Dubois, Interstate 15 Idaho 22
- Ririe, US 26
- Mud Lake, Idaho 33
- Swan Valley, US 26 Idaho 31
- Island Park, US 20
- Spencer, Interstate 15