Idaho Hunt Planner We got game.
Unit 60
- Region 6
- Upper Snake Region
- Island Park Elk Zone
- Units 60, 60A, 61, 62, 62A.
Game Management Unit Boundary
Those portions of CLARK and FREMONT COUNTIES within the following boundary: beginning at Ashton, then north on U.S. 191-20 to the old (south) Shotgun Valley Road, then west on Shotgun Valley Road to Idmon, then south on the Rexburg-Kilgore Road (Red Road) to the Camas Creek-Jackson Mill Springs Road, then east on Camas Creek-Jackson Mill Springs Road to the Hamilton Hill Road, then southeast on the Hamilton Hill Road to the Sand Creek Road, then southeast on the Sand Creek Road to the old Yellowstone Highway, then east on old Yellowstone Highway to U.S. 191-20, then north on U.S. 191-20 to Ashton, the point of beginning. HARRIMAN STATE PARK WILDLIFE REFUGE-CLOSED.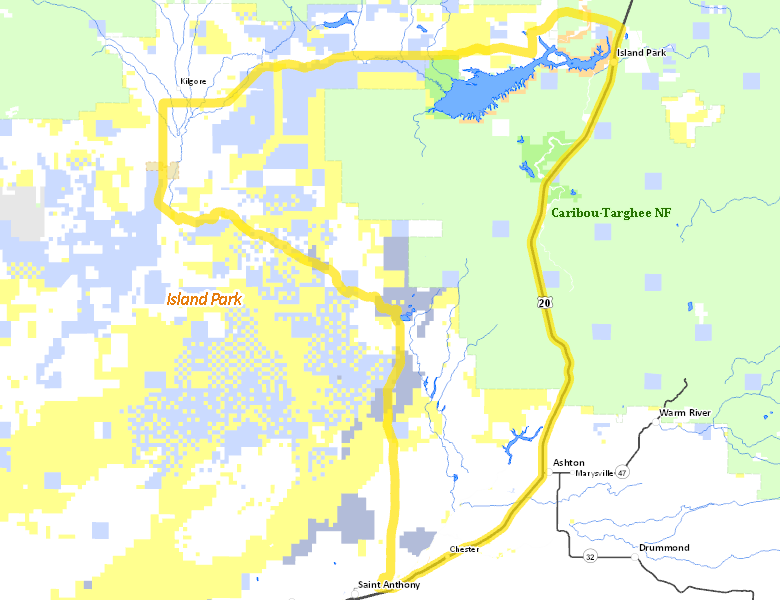
Public Access
Surface Management
For government land, these data show the managing agency of the land, which may or not be the same as the owning agency.
| U.S. Forest Service (USFS) |  37.14
%
37.14
%
|
| Private |
31.02
%
|
| U.S. Bureau of Land Management (BLM) |
11.91
%
|
| State of Idaho |
10.65
%
|
| State of Idaho |
3.77
%
|
| State of Idaho |
3.45
%
|
| U.S. Bureau of Reclamation (BOR) |
1.47
%
|
| Other |
0.59
%
|
Make your own map of Unit 60
Ownership data source: Inside Idaho
Access Yes! Properties
No properties are currently available in Unit 60.
View all Access Yes Participants.
National Forests
Federally-designated Wilderness Areas
No motorized vehicles are allowed in these areas.
There are no wilderness areas in Unit 60.
Land Use/Cover
| Rangeland |
43.41
%
|
| Forest |
41.83
%
|
| Irrigated-Gravity Flow |
5.56
%
|
| Irrigated-Sprinkler |
5.26
%
|
| Water |
3
%
|
| Riparian |
0.96
%
|
| Urban |
0
%
|
Make your own map of Unit 60
Land Use data source: IDWR