Idaho Hunt Planner We got game.
Unit 3
- Region 1
- Panhandle Region
- Panhandle Elk Zone
- Units 1, 2, 3, 4, 4A, 5, 6, 7, 9
Game Management Unit Boundary
Those portions of KOOTENAI, SHOSHONE, and BENEWAH COUNTIES within the following boundary: beginning at Mission Point on the St. Joe River and State Highway 3, then northeast on State Highway 3 to Interstate 90, then east on Interstate 90 to Kingston, then north on Forest Highway 9 (North Fork of the Coeur d’Alene River Road) to Forest Service Road 209 (Little North Fork of the Coeur d’Alene River Road), then northwest along Forest Service Road 209 to the watershed divide between the Coeur d’Alene River and Pend Oreille Lake, then northwest along the divide to Bernard Peak, then north to Steamboat Rock on Pend Oreille Lake, then west along the lake shore to the south boundary fence of Farragut State Park, then west along the boundary fence to State Highway 54 at the west entrance of Farragut State Park, then west on State Highway 54 to U.S. 95, then south on U.S. 95 to Coeur d’Alene Lake, then southeast along the eastern shore line of Coeur d’Alene and Round Lakes to Mission Point, the point of beginning.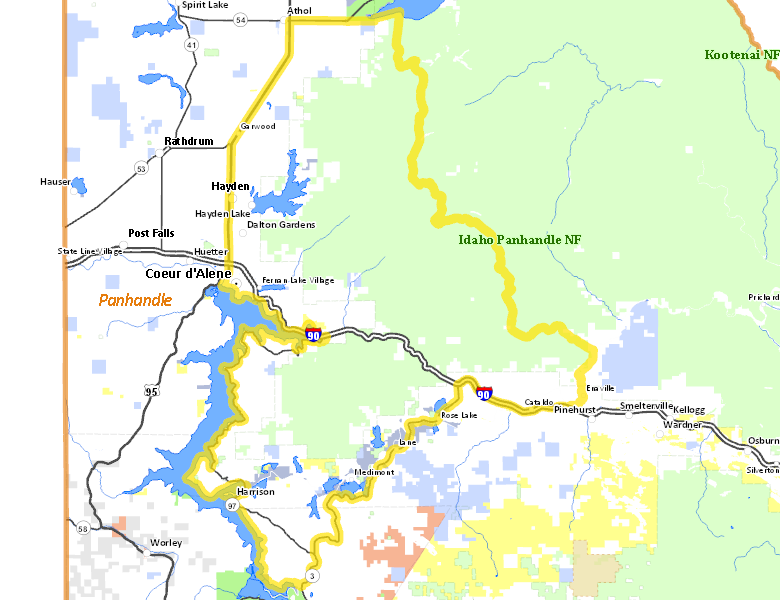
Public Access
Surface Management
For government land, these data show the managing agency of the land, which may or not be the same as the owning agency.
| U.S. Forest Service (USFS) |  51.94
%
51.94
%
|
| Private |
42.49
%
|
| Other |
2.51
%
|
| State of Idaho |
1.4
%
|
| State of Idaho |
0.9
%
|
| U.S. Bureau of Land Management (BLM) |
0.76
%
|
| State of Idaho |
0
%
|
Make your own map of Unit 3
Ownership data source: Inside Idaho
Access Yes! Properties
No properties are currently available in Unit 3.
View all Access Yes Participants.
National Forests
Federally-designated Wilderness Areas
No motorized vehicles are allowed in these areas.
There are no wilderness areas in Unit 3.
Land Use/Cover
| Forest |
75.36
%
|
| Dryland Agriculture |
12.22
%
|
| Riparian |
6.87
%
|
| Urban |
3.22
%
|
| Water |
2.32
%
|
Make your own map of Unit 3
Land Use data source: IDWR