Idaho Hunt Planner We got game.
Unit 2
- Region 1
- Panhandle Region
- Panhandle Elk Zone
- Units 1, 2, 3, 4, 4A, 5, 6, 7, 9
Game Management Unit Boundary
Those portions of BONNER and KOOTENAI COUNTIES within the following boundary: beginning at the intersection of the Idaho-Washington State line and the north bank of the Pend Oreille River, then east along the Pend Oreille River to Pend Oreille Lake at the railroad trestle in the southeast corner of the City of Sandpoint, then south across the railroad trestle, then east and south along the western shore line of Pend Oreille Lake to the south boundary fence of Farragut State Park, then west along the boundary fence to State Highway 54 at the west entrance to Farragut State Park, then west on State Highway 54 to U.S. 95, then south on U.S. 95 to Lake Coeur d’Alene at the source of the Spokane River, then west along the southern bank of the Spokane River to the Idaho- Washington State line, then north along the state line to the point of beginning. FARRAGUT STATE PARK, CLOSED EXCEPT TO ARCHERY.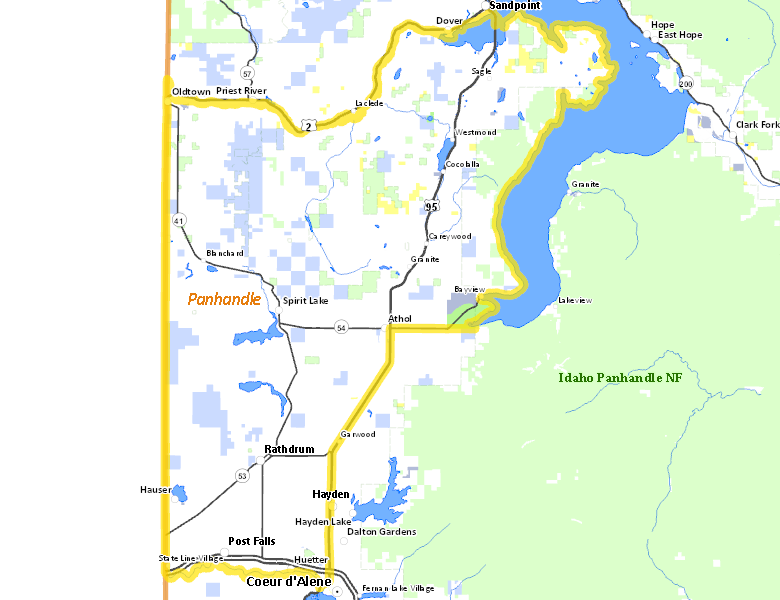
Public Access
Surface Management
For government land, these data show the managing agency of the land, which may or not be the same as the owning agency.
| Private |  78.5
%
78.5
%
|
| State of Idaho |
9.05
%
|
| U.S. Forest Service (USFS) |
6.91
%
|
| Other |
3.4
%
|
| U.S. Bureau of Land Management (BLM) |
1.01
%
|
| State of Idaho |
0.63
%
|
| State of Idaho |
0.47
%
|
Make your own map of Unit 2
Ownership data source: Inside Idaho
Access Yes! Properties
No properties are currently available in Unit 2.
View all Access Yes Participants.
National Forests
Federally-designated Wilderness Areas
No motorized vehicles are allowed in these areas.
There are no wilderness areas in Unit 2.
Land Use/Cover
| Dryland Agriculture |
50.6
%
|
| Forest |
44.04
%
|
| Water |
3.01
%
|
| Urban |
2.35
%
|
Make your own map of Unit 2
Land Use data source: IDWR