May trout stocking schedule for the Southeast Region
Thursday, May 9, 2024 - 4:36 PM MDTLook at what’s headed your way in the Southeast Region during the month of May—nearly 48,000 catchable-sized rainbow trout! Fish on!

F&G Commission meeting May 15-16 in Coeur d'Alene
Thursday, May 9, 2024 - 9:47 AM MDTThe Idaho Fish and Game Commission will hold the public hearing and business meeting at Idaho Fish and Game’s Panhandle Regional Office at 2885 W. Kathleen Avenue in Coeur d'Alene. A public hearing will begin on May 15 at 7 p.m. PDT at the same location.
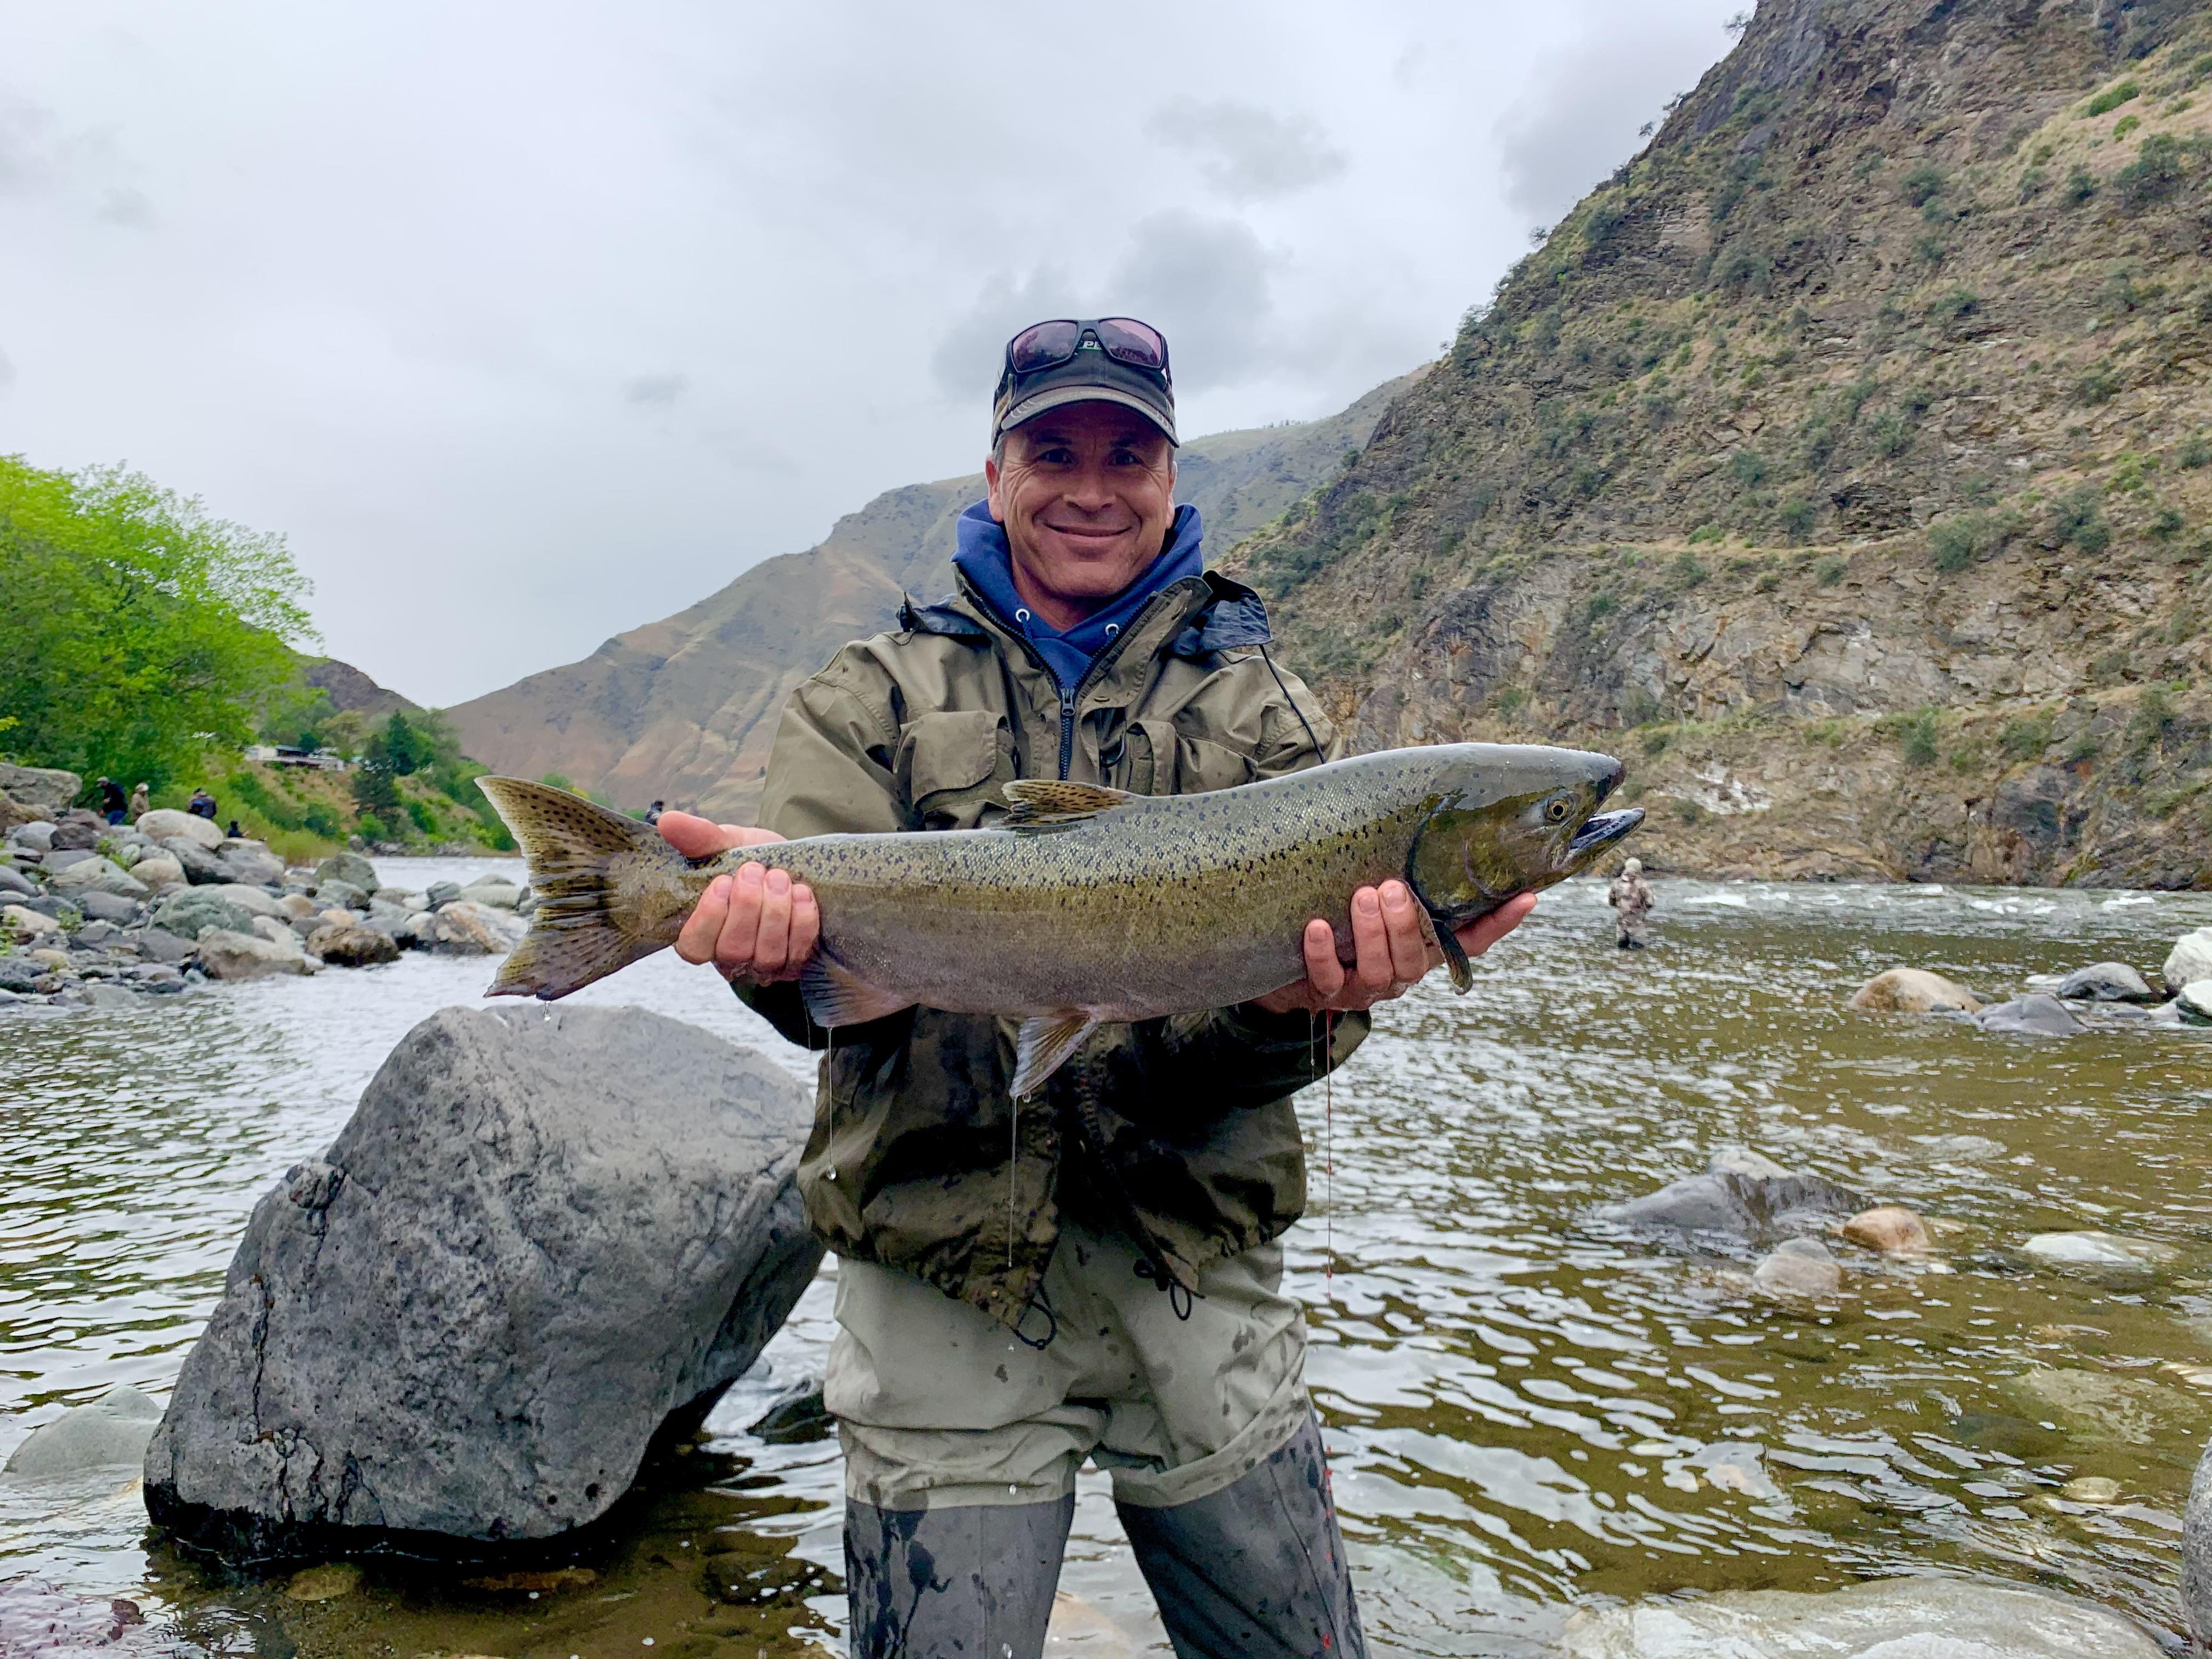
Spring Chinook Salmon Fishing Update 5/8/2024: Rapid River Run, Hells Canyon, and Clearwater River Fisheries
Wednesday, May 8, 2024 - 12:14 PM MDT
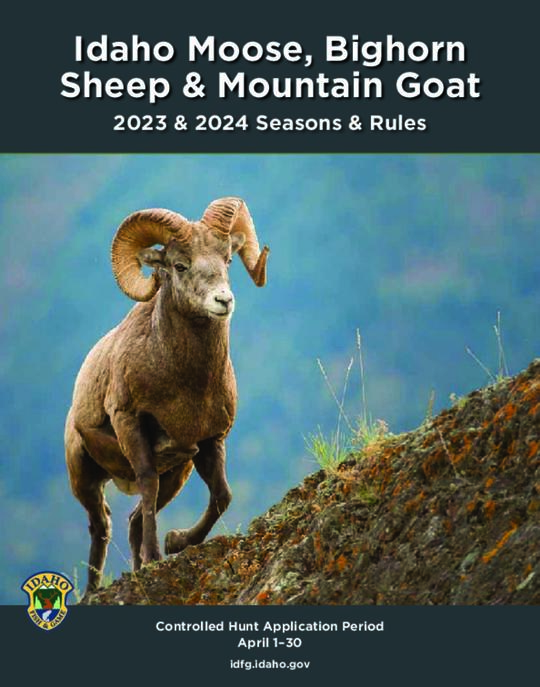
Now available: Controlled hunt drawing results for moose, bighorn sheep and mountain goat
Wednesday, May 8, 2024 - 11:29 AM MDTHunters who applied for controlled hunts for moose, bighorn sheep, and mountain goat hunts can see if they drew a tag by going to www.GoOutdoorsIdaho.com. The second application period for unissued Moose, Sheep, and Mountain Goat tags will be June 15-25.
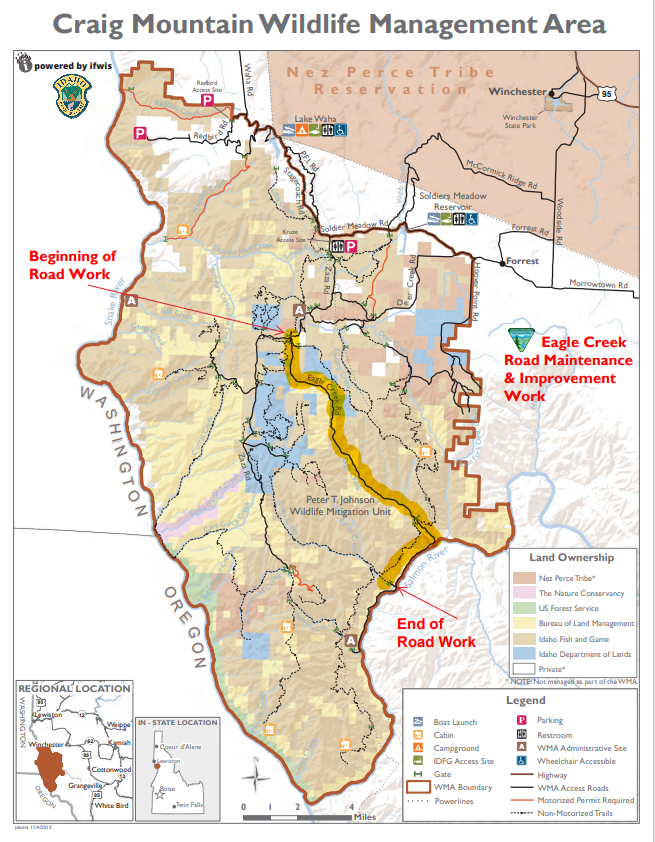
Repair work and improvements to BLM’s Eagle Creek Road on Craig Mountain continue
Monday, May 6, 2024 - 4:43 PM MDTDuring the temporary closure, use of the road by the public is unavailable on weekdays, although the BLM anticipates opening the road to weekend traffic (5 p.m. Fridays through 8 a.m. Mondays) and on federal holidays.
Instructor-led hunter education courses coming up in Southwest Idaho between May and July
Monday, May 6, 2024 - 12:41 PM MDTSouthwest Idaho currently has 13 instructor-led courses slated to start between May and July with seats still available, with more courses to come. Among the upcoming offerings in the Southwest Region are Hunter Education Certification, Hunter & Bowhunter (Combo) Education Certification, and several different Hunting & Shooting Skills workshops.
Youth Outdoor Skills Day and 125 Celebration set for May 11, at Beaver Dick Park
Monday, May 6, 2024 - 10:56 AM MDTIdaho Fish and Game is celebrating 125 years of wildlife conservation at our annual Youth Outdoor Skills Day event. Come join in the fun on Saturday, May 11th, at Beaver Dick Park on Highway 33 from 9am-2pm. The entire event is free and open to the whole family. Participants that take part in at least six skills booths will be entered into a drawing for prizes donated by local organizations. A free hot dog lunch will also be served while supplies last.
Important dates to help plan your May
Monday, May 6, 2024 - 8:32 AM MDTFrom tags sales to general season openers, there’s a lot happening in Idaho next month that you should be aware of. Staying in the loop can be the difference between applying for that coveted controlled hunt tag and watching from the sidelines. Be sure to stay up to date on all Fish and Game happenings. Here are some important dates to help you plan for the month.


Idaho Species Catalog
Explore wildlife in Idaho. Report sightings of wildlife and roadkill.
Browse species